
What if it crashes?
Find peace in your time horizon.

I have had a few people reach out to me wanting to know more about crashes and how this impacts someone’s portfolio.
So, I immediately knew who I needed to reach out to for a visual. None other than Chart Kid Matt. For anyone who is interested in his charts, he writes a weekly newsletter that covers market topics, all with his own charts. I HIGHLY recommend checking it out here.
With that, here is his chart.
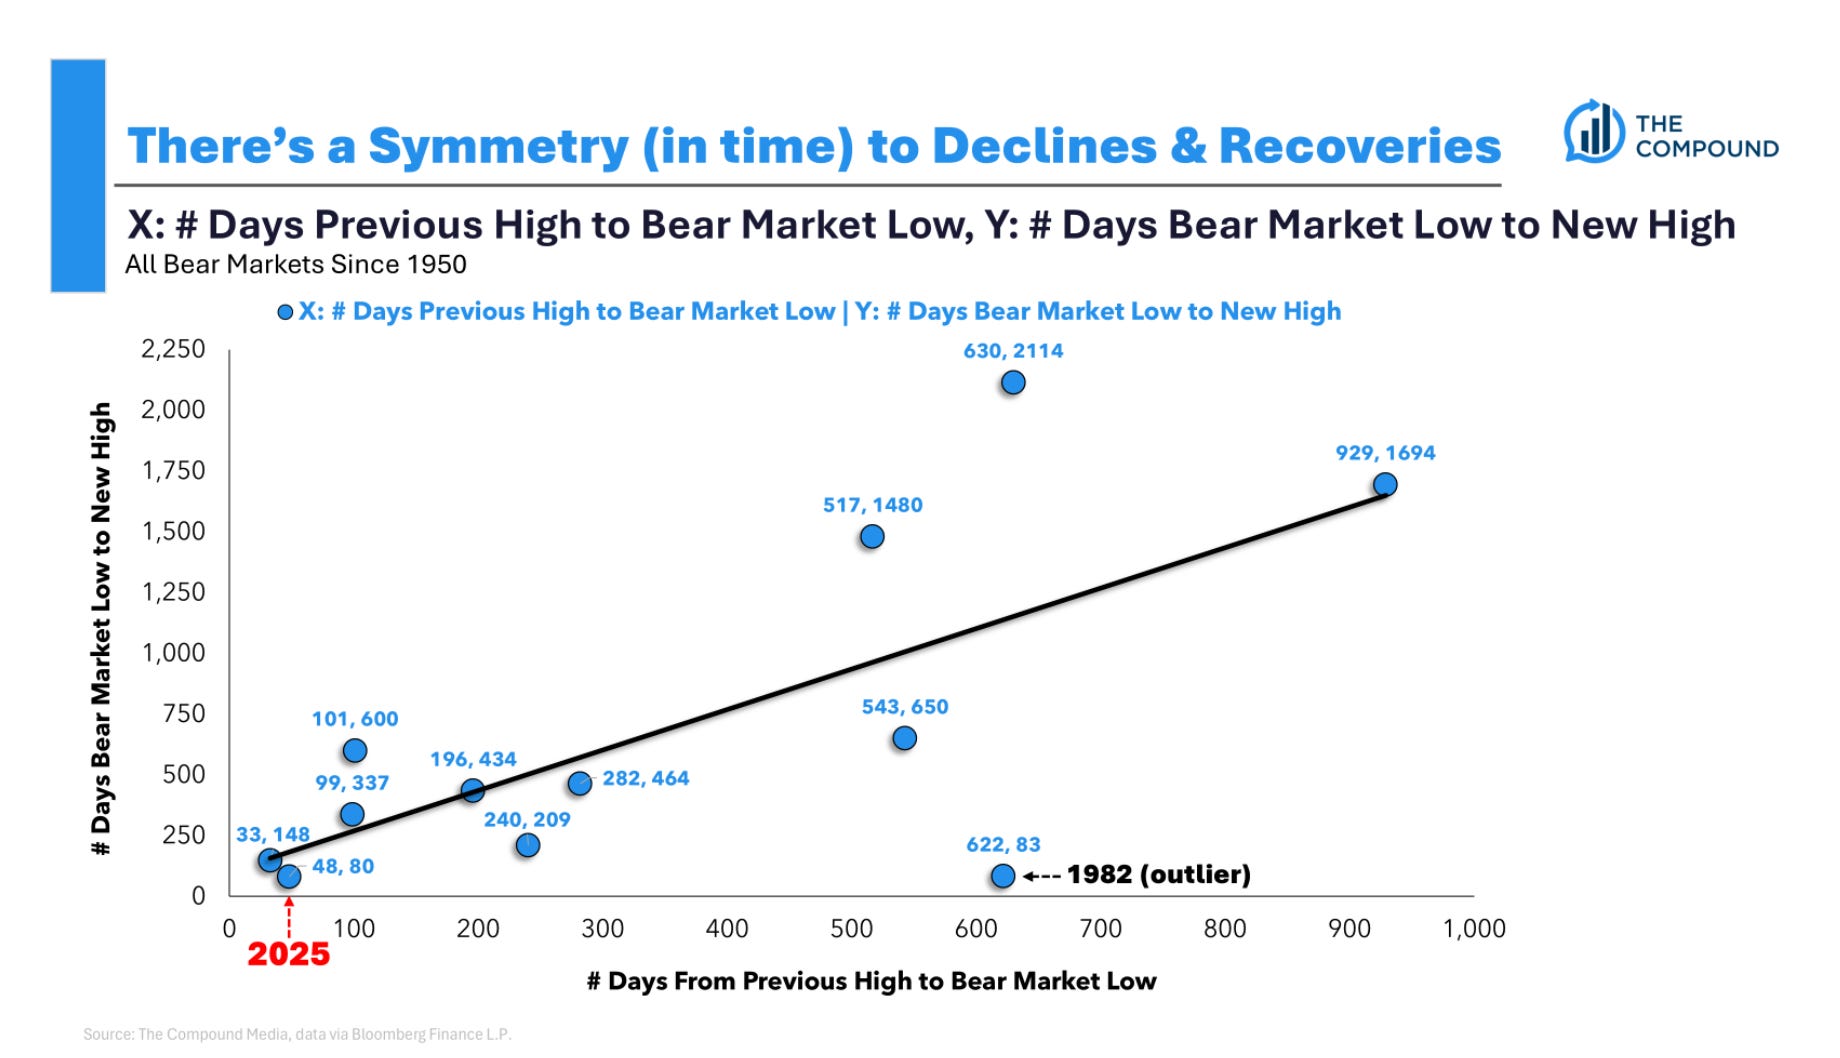
On the X-axis, we have the number of days from the peak of the market to the trough, and on the Y-axis, we have the number of days from the trough to the peak.
Essentially, if we add each data point’s X and Y value, we get the amount of time to reach a new all-time high from the previous peak. Said differently, this gives us the amount of time we’d need to “break even” in price return.
However, we have to remember that there would also be dividends along the way. So, depending on someone’s entry point, the total return may reach “break-even” well before we make new all-time highs.
It is incredibly hard to position yourself around a bear market, but we can be very confident that another one will come our way.
In every circumstance in the chart above, we know that the market eventually recovered and then some! We are currently at all-time highs!
I think one of the most important things I see in Matt’s chart is that in the majority of cases, the time from peak to trough was much less than the trough to a new peak.
The longest amount of time from peak to peak was 2,744 days. While this may seem intimidating, think of those who stayed the course during this time. They were awarded 2,700 days of accumulating assets at compressed prices and are likely much better off today for doing so.
Of course, we are not rooting for any prolonged period of time for markets to perform poorly. Especially when we consider some of the other headwinds something of the sort is usually associated with, such as loss of employment.
I have written about secular bear market remedies in the past and highly encourage everyone to check that out if they want to see more on this topic! Find it here.
While we cannot know when a bear market is coming, when it will bottom, or when it will recover, we can stay the course. And as hard as that may be, young investors have an incredibly long time horizon, which affords them the time to allow markets to recover.
We have experienced a few big sell-offs ourselves! How did you feel during the 2020 COVID crash? How did you feel during 2022? How did you feel during the tariff debacle?
Those events can be a great gauge. Less any changes to employment, did you continue to invest? Did you pause investments until things “got better”?!
As the quote goes, “The stock market is the only store people run out of when everything goes on sale.”
Sticking to your plan and continuing to invest through the good, the bad, and the ugly will likely pay off down the line.
This is for informational purposes only and is not intended as legal or investment advice or a recommendation of any particular security or strategy. The investment strategy and themes discussed herein may be unsuitable for investors depending on their specific investment objectives and financial situation. Opinions expressed in this commentary reflect subjective judgments of the author based on conditions at the time of publication and are subject to change without notice. Past performance is not indicative of future results.