The downsides to downside protection.
The rise of buffer ETFs.
Prior to beginning this piece, I want to leave a disclaimer:
This newsletter is NOT investment or financial advice. The newsletter today is for informational purposes ONLY.
A buffered ETF is designed to track the return of a specific index (up to a predetermined cap) while buffering investors against a predetermined percentage of downside losses over the outcome period, before fees and expenses. Principal protection is not guaranteed and investors may lose their entire investment regardless of when shares are purchased. The full extent of caps and buffers only apply if held for the stated outcome period and are not guaranteed. Caps are subject to change. Investors who make purchases after the outcome period has begun, or sell prior to the conclusion of the outcome period, may experience investment returns very different from those that the defined outcome product seeks to provide.
Buffer ETFs have begun to take off as recently. They are marketed as a way to have market exposure while also having downside protection. Usually, they track an index such as the S&P 500.
They are fairly interesting products that use options to give investors a defined outcome for a certain time period.
It is not uncommon to see these products offering 20% downside protection. For many, this is wildly attractive… I mean, who does not want to be protected in the event the stock market drops 20%?
However, this comes at a cost (outside of the expense ratio). There is a cap on the upside. Each buffer ETF will have a different upside cap depending on the extent of downside coverage it provides.
Now, on paper, this idea seems amazing. And of course, past performance is not indicative of future results, but especially for young investors, capping your upside exposure can seriously diminish someone’s ability to compound.
Here is something to keep in mind: although the S&P 500 has a historical average annual return between 8%-10%, it is unusual to find a year in which the S&P 500 actually returns its historical average return. More on that here.
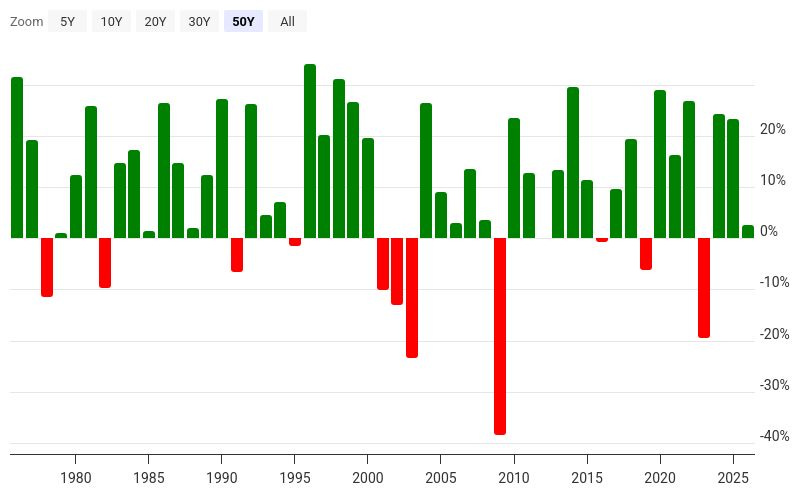
The chart below from macrotrends shows the annual return for the S&P 500.
If we go back to 1975, there were 11 years in which the S&P 500 was negative and 39 years in which it was positive.
Out of those 39 positive years, 29 of them had positive returns in excess of 10%. When the S&P 500 returned above 10%, its average return was 22%.
Meaning that, historically, when the S&P 500 was positive, it was generally very positive. Well outside of what most buffer ETFs would allow participation in.
So, with the rise of buffer ETFs, I wanted to go back and see how a product would have hypothetically performed over history.
Our benchmark will be the S&P 500, and for this hypothetical scenario, we will see how a buffer ETF could have seriously impacted someone’s ability to compound, given the cap on upside.
I went back through the data to see how these parameters would track if someone had the ability to use a 10% participation with a 20% downside buffer since 1975 and began with $10,000.
Note: This is exclusive of any friction (expense fees, trading costs, etc.) AND exclusive of dividends that would have been paid by the S&P 500.
S&P 500: $857,748.58
Buffer ETF: $185,992.73
Everyone wants to achieve market-like returns with less risk or less volatility. However, there is always a trade-off.
Capping the upside while mitigating the downside would have had a significant impact on someone from 1975 to 2024.
I was compelled to write this piece as many young investors are becoming more familiar with or being pitched all these different products that are coming out.
It is incredibly important to know what you are investing in. Having a complete understanding of the product and the potential downsides or opportunity costs is table stakes at this point.


